Introduction
Last year, I bought the Birdie CO₂ monitor 1 to measure my CO₂ values at home. This air quality meter resembles a canary bird, referencing the days where canaries were used in coal mines to detect deadly carbon monoxide. When these stopped singing (or even collapsed 😥), this was a sign that the air quality was poor, and the workers needed to leave the mines 2.
This is how the Birdie looks when the air quality changes from good to bad and again from bad to good:
But what does this mean? How bad is “bad”? According to the specification, the bird drops when CO₂ level is above 1'000 ppm and returns when above 800 ppm. These are also recommended values on various resources on the Internet 3.
Often in the morning, even if the window was partially open during the night, the bird was fallen of it’s perch. This was the point where I was interested in knowing the actual CO₂ values. I wanted a CO₂ sensor that could record measurements over a longer period, allowing me to access the data on a computer and mobile phone without sending it to a cloud service.
Inspired by a talk of a friend at the Winterchaos in 2022 4, I wanted to build my own solution. After some research, I decided to implement this using an ESP32 5 and a CO₂ sensor. The ESP32 will be used to export Prometheus metrics which can then be visualized in a Grafana dashboard.
This blog post explains this implementation. Since I don’t have much experience in such electronics/hardware projects, I think this post is suitable for beginners and I try to explain it as simple as possible.
Hardware Setup
Microcontroller
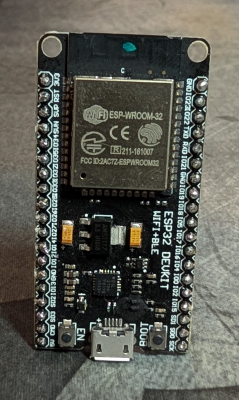
Because I want to have the CO₂ values accessible in the network, I went for the ESP32 microcontroller which has an integrated WiFi module and also because I already had one laying around at home. This board can e.g. be bought in the Adafruit shop 6.
CO₂ Sensor
To measure the CO₂ values, I went for the Adafruit SCD-41 sensor 7, which is a “true” CO₂ sensor.
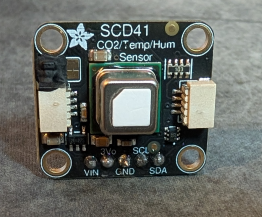
Unlike others, the SCD-41 isn’t approximating it from the VOC gas concentration, but measures the CO₂ concentration in the air in PPM (parts per million). This sensor is produces by the Swiss company Sensirion 8 and can be bought soldered on an a custom-made PCB in the STEMMA QT form factor at Adafruit 9. It can be used industrial or scientific CO₂ measurements as a range of 400 to 5000 ppm with an accuracy of ±(40 ppm + 5% of reading) according to the datasheet 10. In addition, the sensor can also measure the temperature and the relative humidity.
Connecting the Sensor to the ESP32
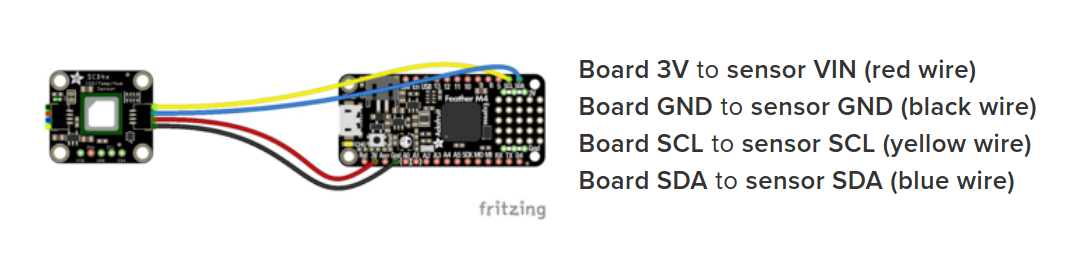
The sensor values can be read via an I²C interface. The documentation 10 shows how the sensor must be wired to the microcontroller using 4 cables:
Where the SCL/SDC PINs on the ESP32 are, can be found in the Espressif ESP32
documentation 11 (note that this can be different on other boards):
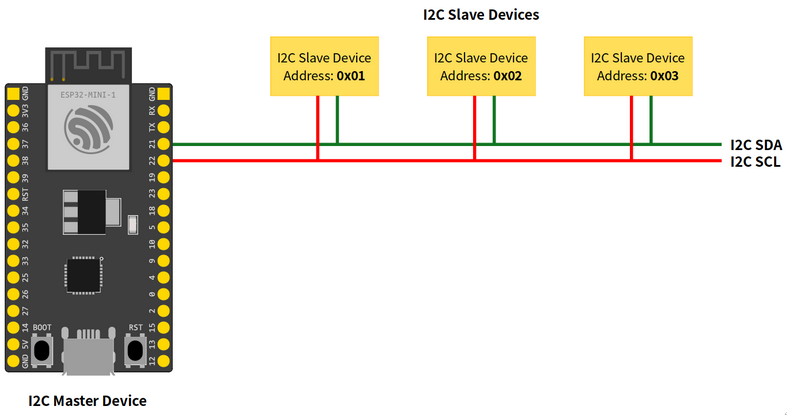
This results in the following connections:
3Vof the sensor →3V/5Von the microcontrollerGNDof the sensor →GNDon the microcontrollerSCLof the sensor →SCLon the microcontroller (GPIO22GPIO PIN on the ESP32)SDAof the sensor →SDAon the microcontroller (GPIO21GPIO PIN on the ESP32)
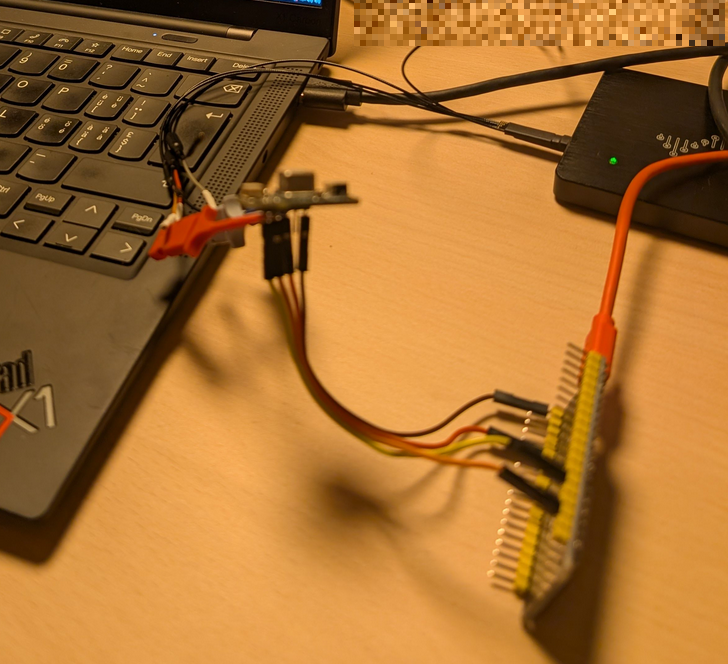
Now, the sensor is connected to the board:
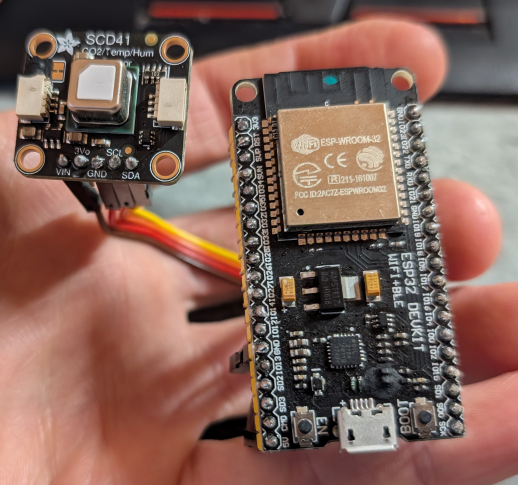
The next step is to program the microcontroller, query the sensor values and make them accessible in the network.
Source Code
Basic Code Example
The SCD-41 datasheet 10 on page 15 has some simple example Arduino code that shows how the sensor can be queried via the I²C interface using a library from Sensirion. It’s not that difficult. Some simplified code which explains the usage:
// [...]
#include <SensirionI2CScd4x.h>

// [...]
SensirionI2CScd4x scd4x;

// [...]

void setup() {
  // [...]
  error = scd4x.startPeriodicMeasurement();
  // [...]
}
void loop() {
  // [...]
  error = scd4x.readMeasurement(co2, temperature, humidity);
  // [...]
    Serial.print("Co2:");
    Serial.print(co2);
    Serial.print("\t");
    Serial.print("Temperature:");
    Serial.print(temperature);
    Serial.print("\t");
    Serial.print("Humidity:");
    Serial.println(humidity);
  // [...]
}
Existing Project on GitHub (Deprecated)
Show Deprecated Text
I found the GitHub repository sighmon/co2_sensor_scd4x_esp32_http_server 1 where someone already implemented some parts I needed. This project creates a simple HTTP endpoint which exports Prometheus metrics that can be visualized in a Grafana dashboard.
My Changes
This however did not work out of the box, so I forked it 2 and implemented some changes
to fix some issues with the TaskScheduler that reads the sensor values,
removed the not needed code for Bluetooth Low Energy (BLE), added support
for static IP addresses and fixed a bug that returned a wrong metric data format. I also created a Grafana dashboard and added this
configuration, because this was missing in the original repo.
Configure, Compile and Upload
So, let’s configure the ESP and upload the code.
Clone my forked Git repository:
git clone https://github.com/emanuelduss/co2_sensor_scd4x_esp32_http_server.git
Copy the secrets template file secrets.tmpl.h to secrets.h:
cp secrets.tmpl.h secrets.h
Add your WiFi credentials to the file secrets.h. Note, your ESP may only support 2.4 GHz WiFi, so use a 2.4 GHz SSID.
const char* SECRET_SSID = "myssid-legacy";
const char* SECRET_PASSWORD = "**************";
const char IPADDRESS[] = {192, 168, 23, 75};
Download the Arduino IDE from https://www.arduino.cc/.
Install the following libraries including their dependencies via Tools → Manage Libraries...:
- Sensirion I2C SCD4x
- TaskScheduler
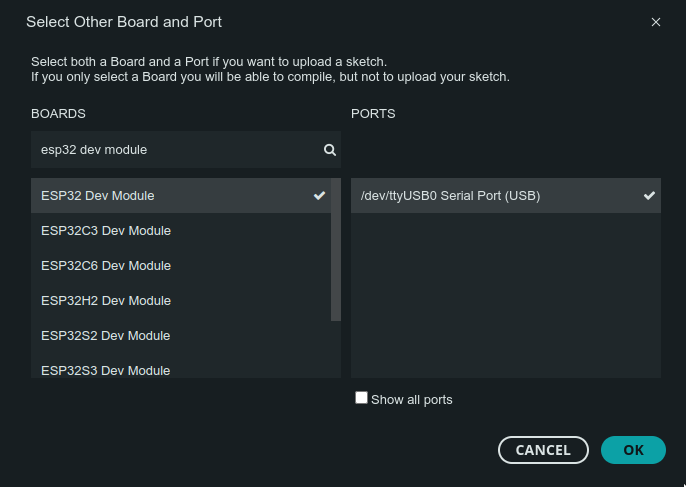
In the dropdown at the top, select the ESP32 board:
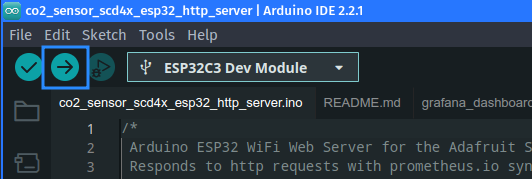
Open the co2_sensor_scd4x_esp32_http_server.ino file and upload it to the ESP32 by pressing the upload / arrow button:
Result
In the serial monitor, you can see how the device connects to your WiFi and prints the measured values:
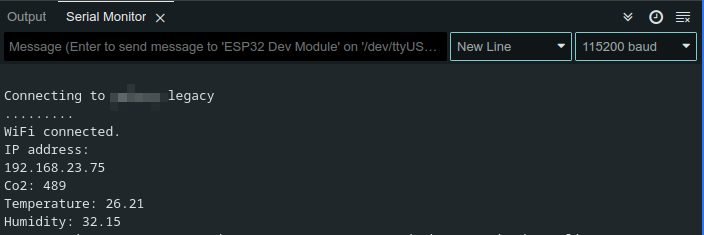
So everything looks good so far!
The device exposes an endpoint on port 80/tcp that exports the CO₂, relative
humidity and temperature metrics:
$ ncat 192.168.23.75 80 <<< ""
HTTP/1.1 200 OK
Content-type: text/plain

# HELP ambient_temperature Ambient temperature
# TYPE ambient_temperature gauge
ambient_temperature 22.52
# HELP ambient_humidity Ambient humidity
# TYPE ambient_humidity gauge
ambient_humidity 43.88
# HELP co2 CO2
# TYPE co2 gauge
co2 984
Because it simply sends this response the values whenever something was received, this also works on HTTP requests:
$ curl http://192.168.23.75
# HELP ambient_temperature Ambient temperature
# TYPE ambient_temperature gauge
ambient_temperature 22.86
# HELP ambient_humidity Ambient humidity
# TYPE ambient_humidity gauge
ambient_humidity 42.92
# HELP co2 CO2
# TYPE co2 gauge
co2 1005
This is exactly the Prometheus text-based exposition format 3 we need to collect it using Prometheus and display it in a Grafana dashboard.
-
GitHub: sighmon/co2_sensor_scd4x_esp32_http_server: https://github.com/sighmon/co2_sensor_scd4x_esp32_http_server ↩︎
-
GitHub Fork: emanuelduss/co2_sensor_scd4x_esp32_http_server: https://github.com/emanuelduss/co2_sensor_scd4x_esp32_http_server ↩︎
-
Prometheus Documentation, Exposition formats: https://github.com/prometheus/docs/blob/main/content/docs/instrumenting/exposition_formats.md ↩︎
New Project (Update 2026-05-17)
I started a new project that better fits my requirements. To make it easier to use, I based it on PlatformIO 12, which integrates well into Visual Studio Code and can also be used through its own CLI tool without needing an IDE.
I updated the Prometheus metrics endpoint to also include the device location. This way, multiple sensors can now be displayed in the same Grafana dashboard without mixing up where the data is coming from. The endpoint is now served via a real webserver.
This becomes especially useful once you have more than one device running in different rooms. Instead of treating all CO₂ values as a single stream, each sensor can now be identified and visualized separately.
At the same time, I also wanted the data to be available in Home Assistant 13. For this, I implemented an MQTT integration.
I use Mosquitto 14 as the MQTT broker, which is also the same broker Home Assistant is connected to. The ESP32 device then uses Home Assistant’s MQTT auto-discovery 15 feature by publishing a configuration message to a topic like homeassistant/device/esp32-bedroom/config. This message contains the device metadata, such as the device name, available metrics, units, and other sensor details.
Once the device is registered, it starts publishing its actual sensor readings to a separate topic, for example /esp32/bedroom, which contains the live values.
Device Configuration
So, let’s configure the ESP and upload the code.
Clone the repository:
git clone https://github.com/emanuelduss/esp32-co2-scd41
Copy the example settings file:
cp src/settings.h.example src/settings.h
Adjust your settings:
// Device
const char* DEVICE_DESCRIPTION = "ESP32 SCD41 Bedroom Sensor";
const char* DEVICE_NAME = "esp32-bedroom";

// Wi-Fi
const char* WIFI_SSID = "wifi-legacy";
const char* WIFI_PASSWORD = "password";
const char IPADDRESS[] =  {192, 168, 1, 10};

// MQTT
const char* MQTT_SERVER = "192.168.1.5";
const int MQTT_PORT = 1883;
const char* MQTT_USERNAME = "username";
const char* MQTT_PASSWORD = "password";
const char* MQTT_TOPIC = "esp32/bedroom";
const int MQTT_PUBLISH_INTERVAL = 60; // Seconds
const char* MQTT_AUTO_DISCOVER_TOPIC_PREFIX = "homeassistant";
The settings should be be self-explanatory. You should use different passwords for your ESP32 devices and Home Assistant, since these are not required to share the same user account on the MQTT broker. Also note, that MQTT is used in cleartext, so the credentials and measurement values are sent in cleartext over the network. I accepted this risk for this use-case in my home setup 😉.
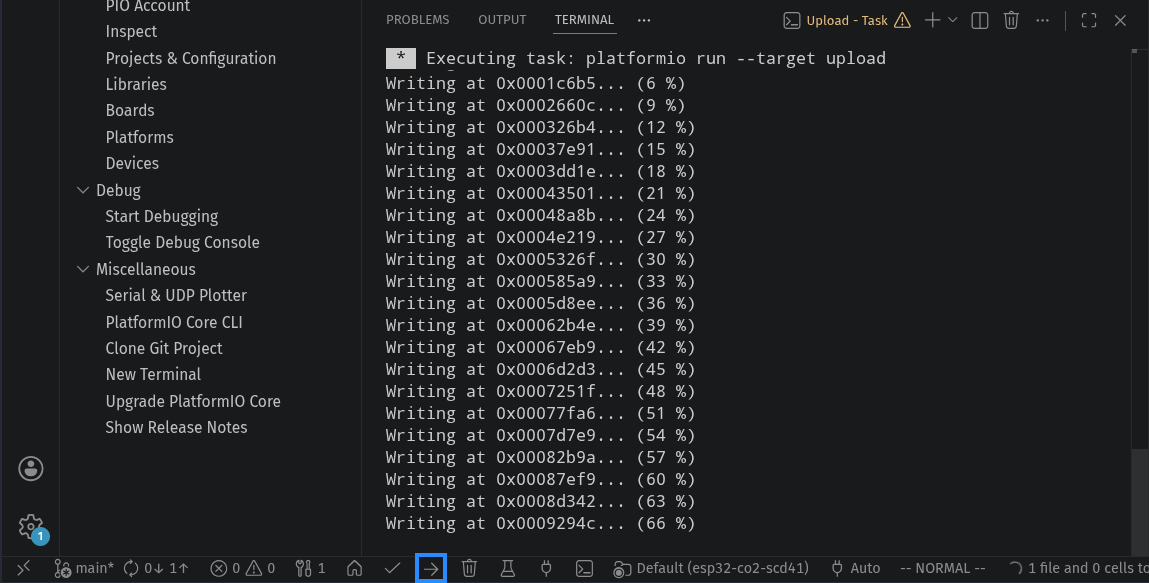
Upload via Visual Studio Code
Open Visual Studio Code and install the PlatformIO extension 16. Open the folder as a PlatformIO project. Connect your ESP32 via USB to the computer. Then build and upload the firmware using the arrow button on the bottom or by pressiong Ctrl+Alt+U:
PlatformIO Command
Install PlatformIO for your operating system 17, then build and upload the code it to your ESP:
pio run --target upload
Verification
You should see the following output if the upload was successful:
[...]
Writing at 0x000c6cd4... (90 %)
Writing at 0x000cc37f... (93 %)
Writing at 0x000d186d... (96 %)
Writing at 0x000d72ba... (100 %)
Wrote 821520 bytes (528163 compressed) at 0x00010000 in 12.6 seconds (effective 521.6 kbit/s)...
Hash of data verified.

Leaving...
Hard resetting via RTS pin...
============================================================ [SUCCESS] Took 17.15 seconds ============================================================
Attach to the serial console, and press the reset button on your ESP to see how the device starts and reads the sensor values:
$ sudo stty -F /dev/ttyUSB0 115200

$ cat /dev/ttyUSB0
rst:0x1 (POWERON_RESET),boot:0x13 (SPI_FAST_FLASH_BOOT)
configsip: 0, SPIWP:0xee
clk_drv:0x00,q_drv:0x00,d_drv:0x00,cs0_drv:0x00,hd_drv:0x00,wp_drv:0x00
[...]

Device starting up...
Device description: ESP32 SCD41 Livingroom Sensor
Device name: esp32-livingroom
Serial number: 0xAABBCCDDEEFF
Connecting to Wi-Fi foobar-legacy....... connected. IP address: 192.168.23.75
Connecting to MQTT broker... connected
Publishing MQTT auto-discovery message:
{"dev":{"ids":"esp32-livingroom","name":"ESP32 SCD41 Livingroom Sensor","mf":"Self-Made","mdl":"ESP32 SCD41 Sensor","sw":"1.0","sn":"esp32-livingroom_AA:BB:CC:DD:EE:FF","hw":"rev1"},"o":{"name":"esp32-livingroom","sw":"1.0","url":"https://emanuelduss.ch/posts/co2-measurement/"},"cmps":{"co2":{"p":"sensor","device_class":"carbon_dioxide","unit_of_measurement":"ppm","value_template":"{{ value_json.co2 }}","unique_id":"esp32-livingroom_co2"},"temperature":{"p":"sensor","device_class":"temperature","unit_of_measurement":"°C","value_template":"{{ value_json.temperature }}","unique_id":"esp32-livingroom_temperature"},"humidity":{"p":"sensor","device_class":"humidity","unit_of_measurement":"%","value_template":"{{ value_json.humidity }}","unique_id":"esp32-livingroom_humidity"}},"state_topic":"esp32/livingroom","qos":1}
Starting webserver... started.
Setup complete. Sensor is ready.
Co2: 461 | Temperature: 27.61 | Humidity: 35.57
Published to MQTT topic esp32/livingroom on 192.168.23.5: {"temperature":27.61,"humidity":35.57,"co2":461}
Co2: 451 | Temperature: 27.21 | Humidity: 36.30
Co2: 449 | Temperature: 27.02 | Humidity: 36.76
[...]
The output shows that the device connected to the configured Wi-Fi, connected to the MQTT broker, sends the MQTT auto-discovery message and then the values every 5 seconds.
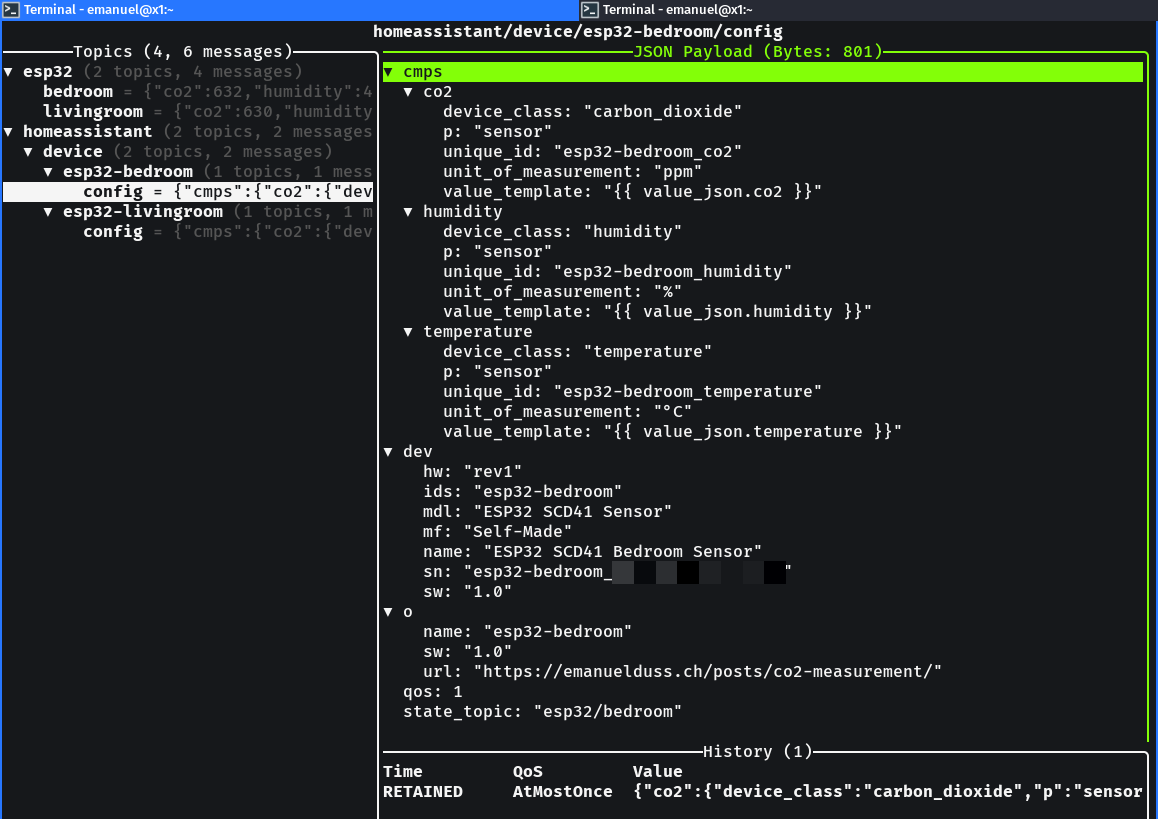
These messages can also be seen in an MQTT browser:
mqttui --username username --password password --broker mqtt://192.168.23.5
Example:
You can also subscribe to a topic and get new messages:
$ mosquitto_sub -h 192.168.23.5 -t '#' -u usernamed -P password
{"dev":{"ids":"esp32-livingroom","name":"ESP32 SCD41 Livingroom Sensor","mf":"Self-Made","mdl":"ESP32 SCD41 Sensor","sw":"1.0","sn":"esp32-livingroom_AA:BB:CC:DD:EE:FF","hw":"rev1"},"o":{"name":"esp32-livingroom","sw":"1.0","url":"https://emanuelduss.ch/posts/co2-measurement/"},"cmps":{"co2":{"p":"sensor","device_class":"carbon_dioxide","unit_of_measurement":"ppm","value_template":"{{ value_json.co2 }}","unique_id":"esp32-livingroom_co2"},"temperature":{"p":"sensor","device_class":"temperature","unit_of_measurement":"°C","value_template":"{{ value_json.temperature }}","unique_id":"esp32-livingroom_temperature"},"humidity":{"p":"sensor","device_class":"humidity","unit_of_measurement":"%","value_template":"{{ value_json.humidity }}","unique_id":"esp32-livingroom_humidity"}},"state_topic":"esp32/livingroom","qos":1}
{"temperature":24.43,"humidity":43.19,"co2":461}
{"temperature":22.17,"humidity":46.06,"co2":589}
{"temperature":24.31,"humidity":43.52,"co2":445}
[...]
The webserver exposes the metrics on both / and /metrics:
$ curl 192.168.23.76
# HELP ambient_temperature_celsius Ambient temperature
# TYPE ambient_temperature_celsius gauge
ambient_temperature_celsius{location="Livingroom" device="esp32-livingroom"} 22.18
# HELP ambient_humidity_percent Relative humidity
# TYPE ambient_humidity_percent gauge
ambient_humidity_percent{location="Livingroom" device="esp32-livingroom"} 46.03
# HELP co2_ppm Indoor CO2 concentration in ppm
# TYPE co2_ppm gauge
co2_ppm{location="Livingroom" device="esp32-livingroom"} 591
MQTT / Home Assistant Integration
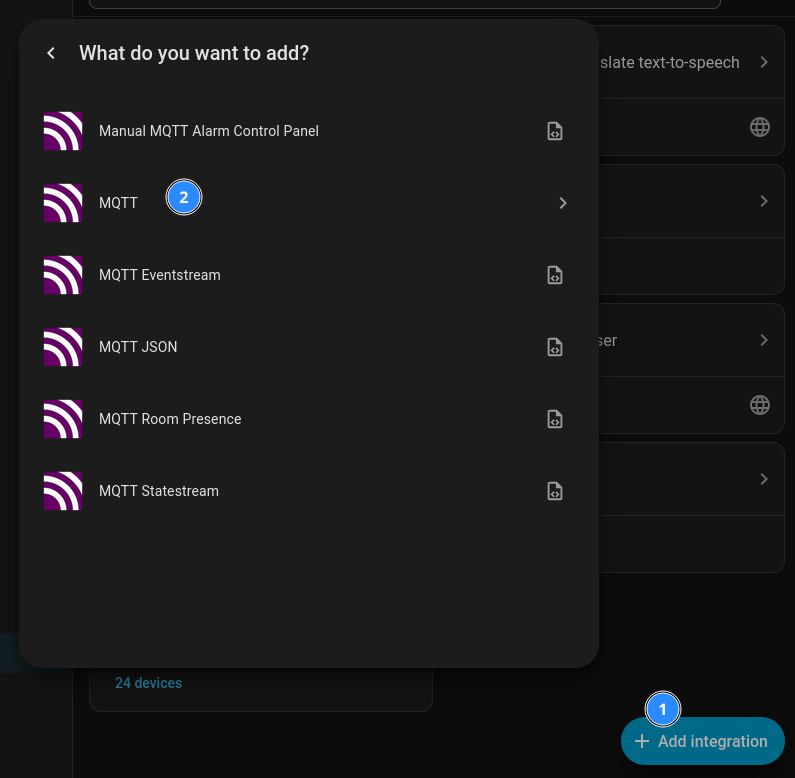
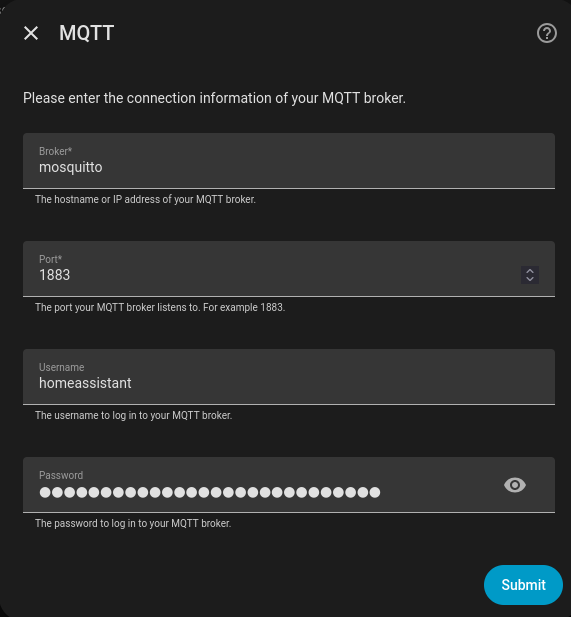
You have to install the MQTT integration 18 in Home Assistant:
Configure your MQTT credentials:
Because of the MQTT auto-discovery, the devices automatically appear in Home Assistant:
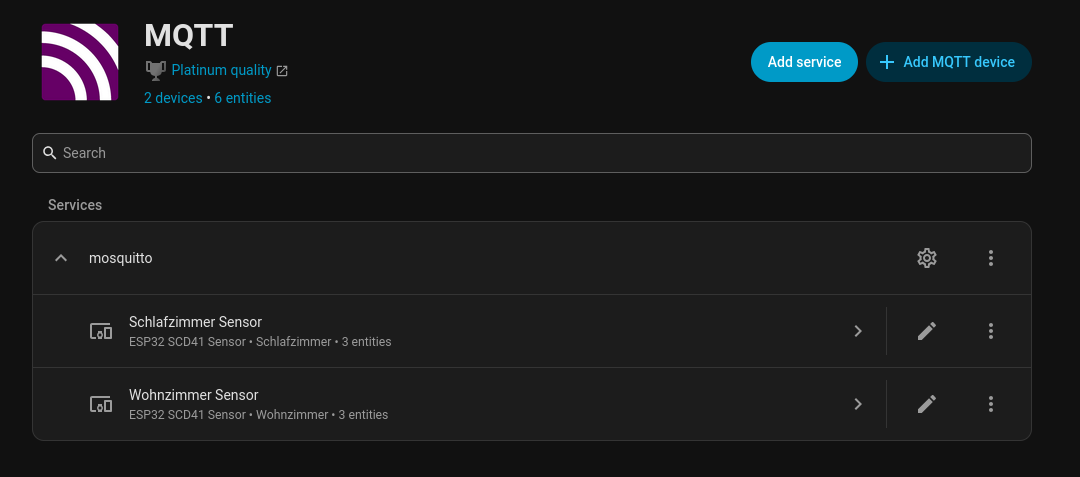
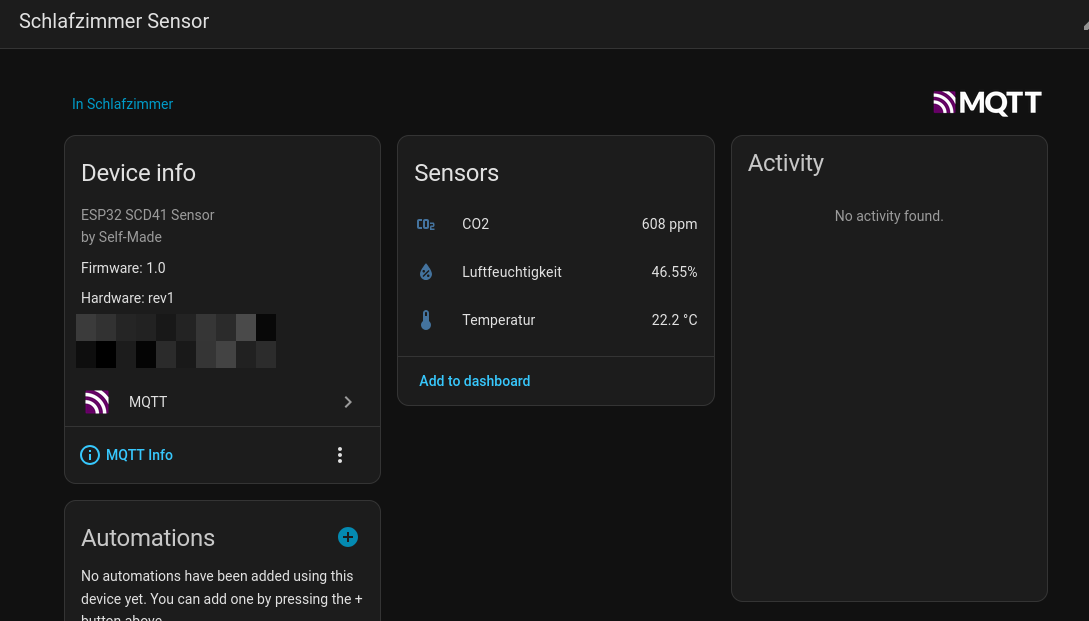
These devices automatically expose their sensor values and are automatically recognized because of the MQTT auto-discovery:
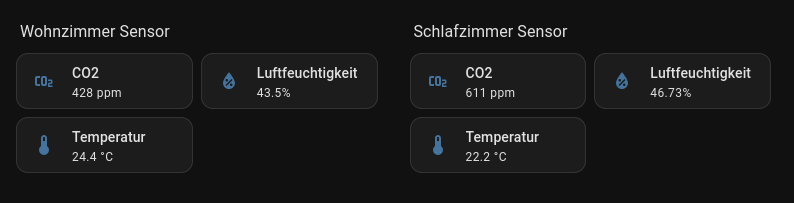
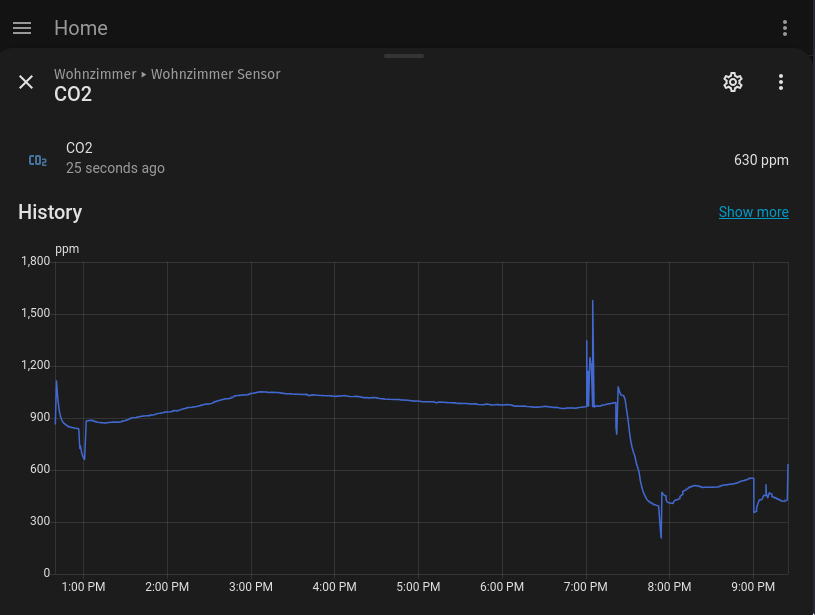
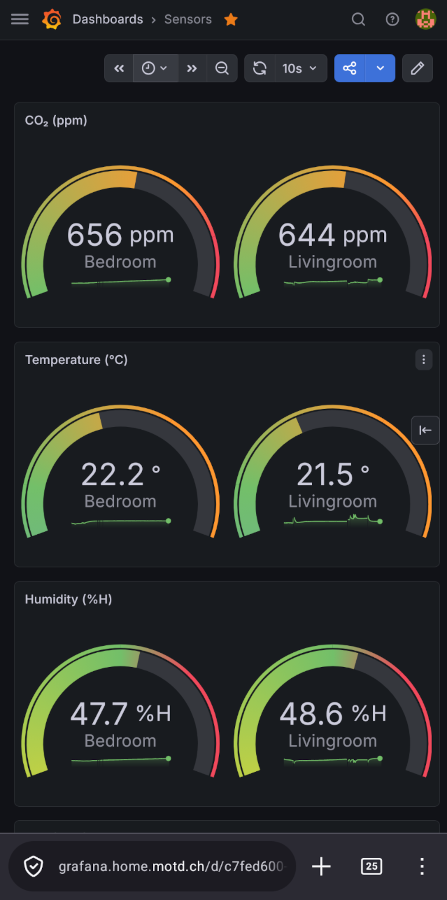
These can for example be embedded in a dashboard:
Home Assistant can also show a graph:
Prometheus Configuration & Grafana Dashboard
I used an already existing Prometheus and Grafana infrastructure in combination with the Traefik reverse proxy 19 based on Docker containers using the official images 20 21. If you want to reproduce the Traefik setup which also configures Let’s Encrypt certificates automatically, you can use the template from my repository 22.
A simplified docker-compose.yml file could look like this:
services:

  prometheus:
    image: prom/prometheus:latest
    restart: unless-stopped
    command:
      - '--storage.tsdb.retention.time=10y'
      - '--config.file=/etc/prometheus/prometheus.yml'
      - '--storage.tsdb.path=/prometheus'
      - '--web.console.libraries=/usr/share/prometheus/console_libraries'
      - '--web.console.templates=/usr/share/prometheus/consoles'
    volumes:
      - ./prometheus_config:/etc/prometheus/
      - ./prometheus_data:/prometheus

  grafana:
    image: grafana/grafana:latest
    restart: unless-stopped
    volumes:
      - ./grafana_data:/var/lib/grafana
    environment:
      - GF_SECURITY_ADMIN_PASSWORD=changeme
      - GF_USERS_ALLOW_SIGN_UP=false
      - GF_SERVER_DOMAIN=example.net
      - GF_SMTP_ENABLED=false
The exact Prometheus & Grafana setup is not part of this post, but you can find a template for the necessary containers here: https://github.com/emanuelduss/esp32-co2-scd41/tree/main/dashboard.
A new job has to be added in the Prometheus configuration prometheus.yml:
# [...]
scrape_configs:
# [...]
  - job_name: sensor1
    static_configs:
      - targets:
        - 192.168.23.75:80
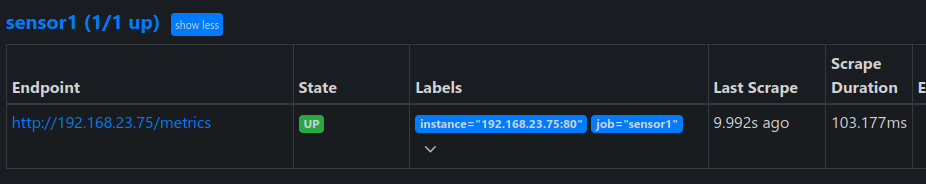
This entry should then show up in the target list:
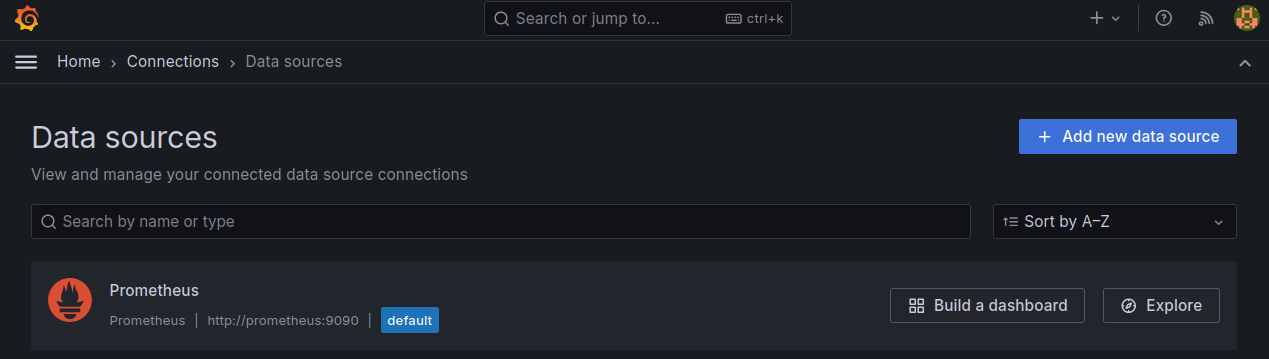
In Grafana, the Prometheus data source has to be configured:
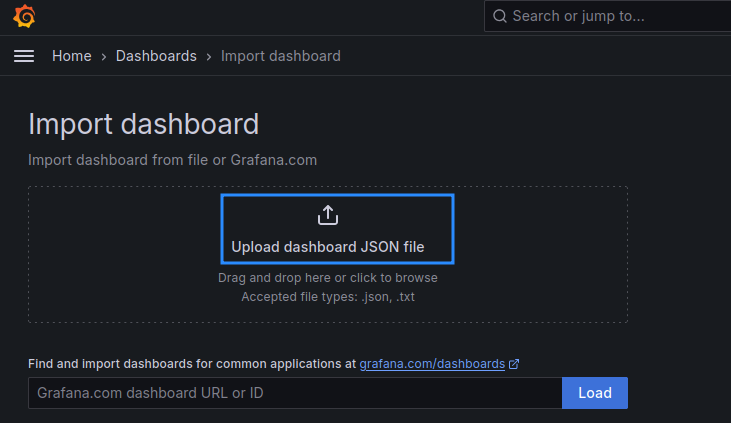
Then, the dashboard configuration can be imported:
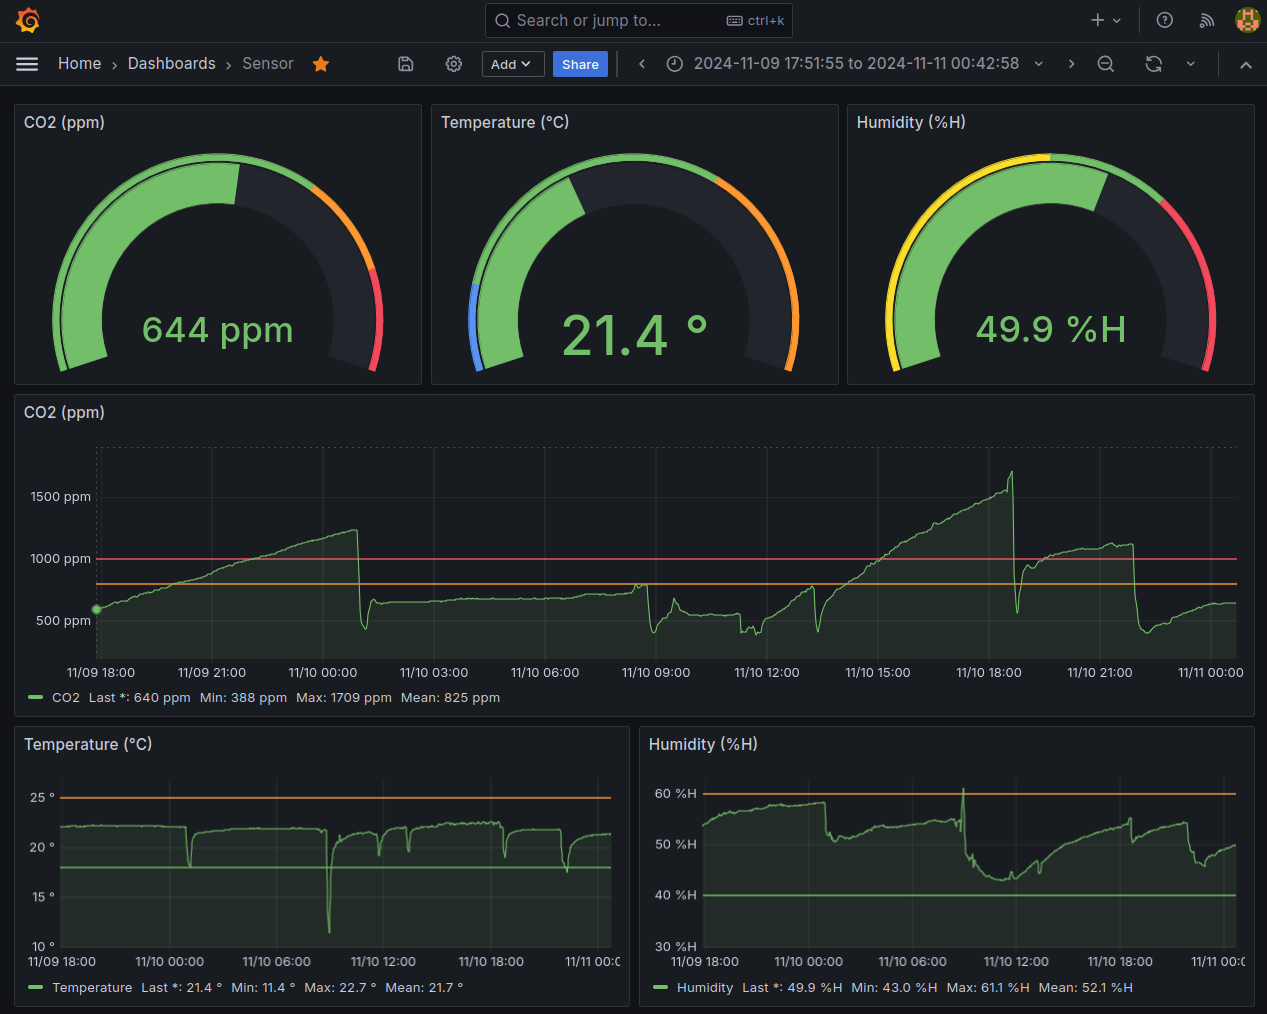
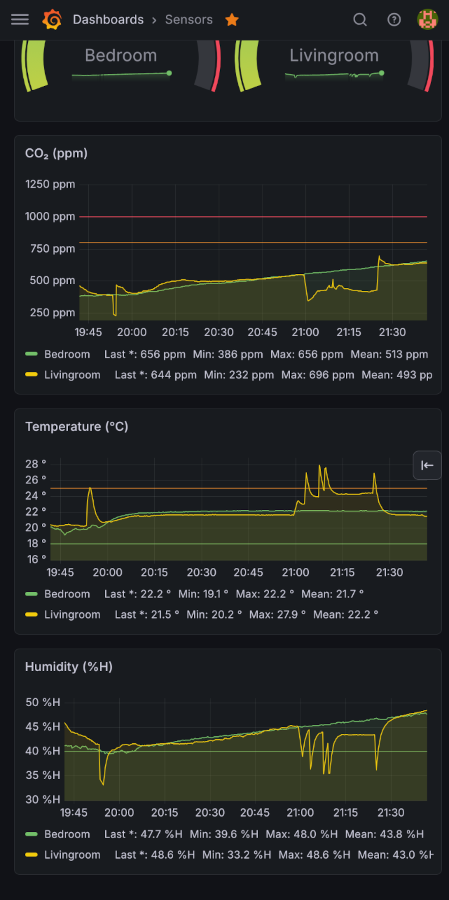
After collecting some data, the dashboard shows the current and past CO₂ level in ppm, temperature and humidity:
Because my phone is connected to my home network via Wireguard (explained in this blogpost here 23), I can also access the dashboard when I’m not at home:
Alternatives
- A very cool alternative is the Datagnome (Datenzwerg) project 24. These Datagnomes can collect more data and have more features.
- There are also several tutorials on how you can 3D-print and build your own Birdie 25.
Sniffing I²C Communication (Update 2026-02-15)
Just as a fun experiment, I wanted to have a look at the I²C communication.
I connected a logic analyzer to the SCL, SDA and GND pins which are connected to the ESP:
After sniffing the communication for a while, the I²C communication can be seen in the software of the logic analyzer by using an I²C decoder:
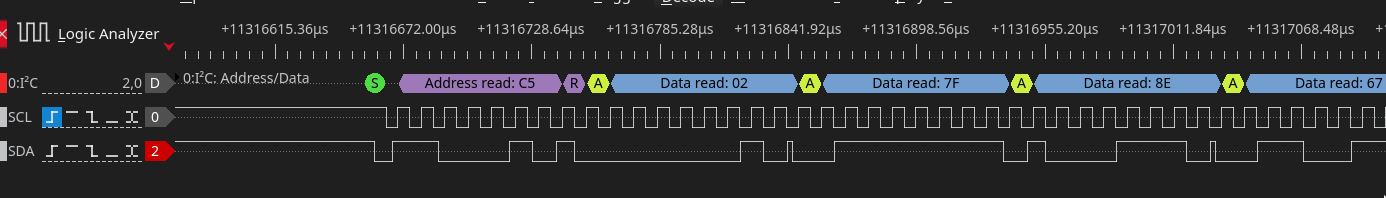
The datasheet of the SDC4x sensor 26 shows how to parse the measurements:
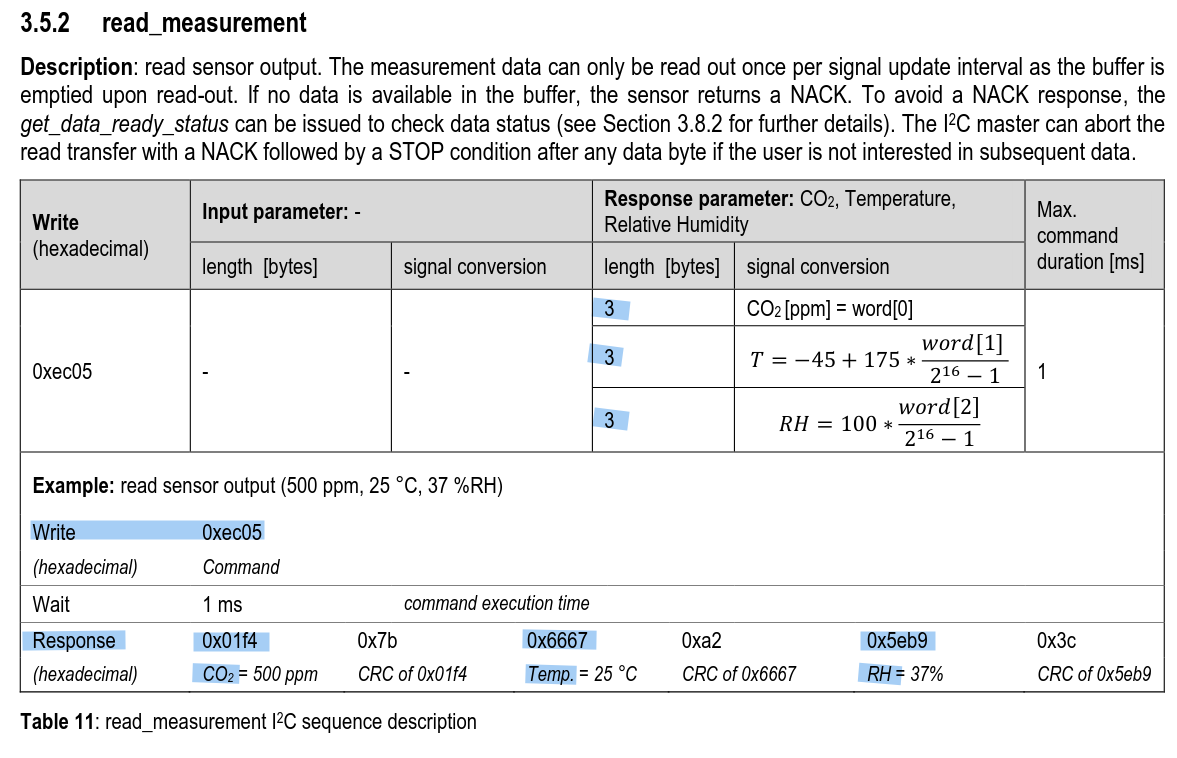
- First, there is a write command
0xEC05 - Then the response is 3 bytes (the last one is a CRC checksum) for the CO₂, temperature and humidity.
- The CO₂, value can be parsed as-is, the temperature and humidity value have to be converted according to the formula shown.
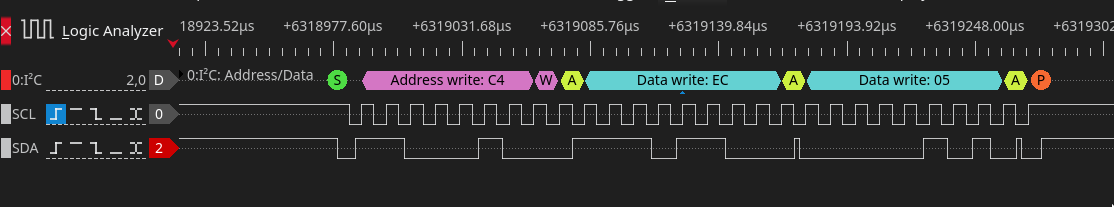
This is the write command 0xEC05 for a read measurement:
The response:
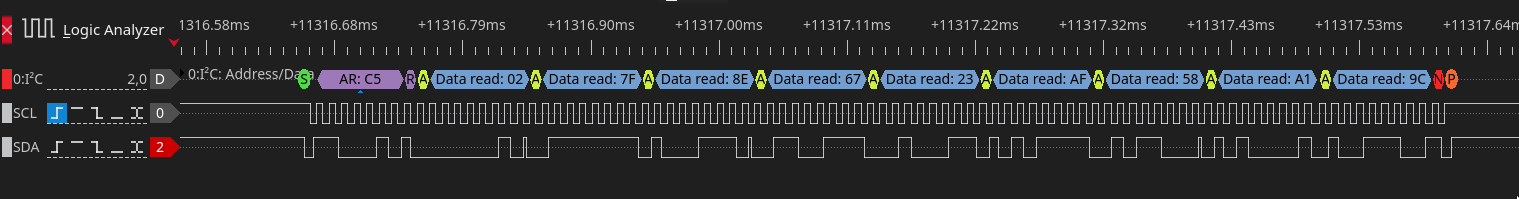
- CO₂,:
0x027F8E - Temperature:
0x6723AF - Humidity:
0x58A19C
Convert the CO₂ value 0x027F:
$ bc -lq
# Convert hex to dec
obase=10
ibase=16
027F # read value
639 # value in dec
- The read CO₂ value is 639 ppm
Convert the temperature value 0x6723:
$ bc -lq
# Convert hex to dec
obase=10
ibase=16
6723 # read value
26403 # value in dec

# Back to dec
ibase=A

# Apply formula to get temperature
-45+(175*(26403/(2^16-1)))
25.50469214923323414925
- The temperature is 25.5 °C
Convert the humidity value 0x58A1:
$ bc -lq
# Convert hex to dec
obase=10
ibase=16
58A1
22689 # value in dec

# Back to dec
ibase=A

# Apply formula
100*(22689/(2^16-1))
34.62119478141451132900
- The humidity value is 34.6%
-
Birdie CO₂ Meter: https://www.birdie.design/ ↩︎
-
What Happened to the Canary in the Coal Mine? The Story of How the Real-Life Animal Helper Became Just a Metaphor: https://www.smithsonianmag.com/smart-news/what-happened-canary-coal-mine-story-how-real-life-animal-helper-became-just-metaphor-180961570/ ↩︎
-
CO2Meter, Carbon Dioxide Levels Chart: https://www.co2meter.com/blogs/news/carbon-dioxide-indoor-levels-chart ↩︎
-
Winterchaos Talk, Open Source Luftqualitäts-Monitoring für Zuhause: https://media.ccc.de/v/luzern-2818-open-source-luftqualitats-mo ↩︎
-
Adafruit Shop ESP32: https://www.adafruit.com/search?q=esp32 ↩︎
-
Adafruit SCD-40 and SCD-41: https://learn.adafruit.com/adafruit-scd-40-and-scd-41 ↩︎
-
Sensirion SCD41 Sensor: https://sensirion.com/products/catalog/SCD41 ↩︎
-
Adafruit SCD-41 - True CO2 Temperature and Humidity Sensor - STEMMA QT / Qwiic: https://www.adafruit.com/product/5190 ↩︎
-
Adafruit SCD-40 and SCD-41 Datasheet: https://cdn-learn.adafruit.com/downloads/pdf/adafruit-scd-40-and-scd-41.pdf ↩︎ ↩︎ ↩︎
-
Espressif ESP32 Documentation for I²C: https://docs.espressif.com/projects/arduino-esp32/en/latest/api/i2c.html ↩︎
-
PlatformIO: https://platformio.org/ ↩︎
-
Home Assistant: https://www.home-assistant.io/ ↩︎
-
Eclipse Mosquitto MQTT Broker: https://mosquitto.org/ ↩︎
-
Home Assistant MQTT Auto Discovery: https://www.home-assistant.io/integrations/mqtt/#mqtt-discovery ↩︎
-
PlatformIO Extension for Visual Studio Code: https://platformio.org/install/ide?install=vscode ↩︎
-
PlatformIO Installation: https://docs.platformio.org/en/latest/core/installation/index.html ↩︎
-
Home Assistant MQTT Integration: https://www.home-assistant.io/integrations/mqtt/ ↩︎
-
Traefik Reverse Proxy: https://traefik.io/traefik/ ↩︎
-
Prometheus Docker Image: https://hub.docker.com/r/prom/prometheus ↩︎
-
Grafana Docker Image: https://hub.docker.com/r/grafana/grafana ↩︎
-
Traefik/Prometheus/Grafana Example Setup: https://github.com/emanuelduss/co2_sensor_scd4x_esp32_http_server/tree/main/dashboard ↩︎
-
Wireguard Road Warrior Setup: https://emanuelduss.ch/posts/wireguard-vpn-road-warrior-setup/ ↩︎
-
Datagnome / Datenzwerg Project: https://datagnome.de/ ↩︎
-
Birb - the Canary Shaped Air Quality Sensor: https://www.printables.com/model/450447-birb-the-canary-shaped-air-quality-sensor ↩︎
-
Sensirion, SDC4x Datasheet: https://sensirion.com/media/documents/48C4B7FB/64C134E7/Sensirion_SCD4x_Datasheet.pdf ↩︎